Geomorphological mapping
Geomorphological mapping has a long history and is subject to continual development, from the classical field-based mapping of the pre-digital age to the computer-based mapping of the present time. We present an overview of this development by using the example of geomorphological mapping in the mountainous area of the state of Vorarlberg (Austria). It is largely based on Chapter 2 Geomorphological maps of the book Geodiversity of Vorarlberg and Liechtenstein by Seijmonsbergen et al. (2014) and on a recent publication on hierarchical geomorphological mapping by De Jong et al. (2021) in Journal of Maps (see Literature).
Our overview consists of four parts:
- What is geomorphology?
- Classical geomorphological mapping
- Computer-assisted geomorphological mapping
- The latest development: hierarchical geomorphological mapping
What is geomorphology?
Geomorphology can loosely be defined as the study of landforms and of the geological forces that produce them. Geomorphology combines form, material and genesis. Form refers to the outer shape of landscapes and landscape elements, material to the substratum, i.e. the consolidated and unconsolidated rocks that underlie the surface of the landforms, and genesis to the past and present processes that have created the landforms. Making maps – on paper or digitally – is an essential component of geomorphological studies.
A geomorphological map is more than just a way of presenting data. It is also a synthesis of research: mapping reveals the geomorphological setting, i.e. the association of landforms, which is essential for the understanding of both individual landforms and landscapes as a whole.
An important aspect of the geomorphological map is that it can serve as a principal basis for further work. Derivative or thematic maps can be generated highlighting certain geomorphological features or showing applied aspects of geomorphology, e.g., potential geoconservation maps (Geodiversity-Geoconservation).
Classical geomorphological mapping
Classical geomorphological maps are representations of landforms – their outer shapes, underlying materials and formative processes – that are usually made in the field – often supported by airphoto analysis – and are typically presented on paper. Symbols and colours are used in various combinations to ‘depict’ the landforms or landscapes. For instance, a variety of point symbols, lines and polygons may be used to draw geomorphological boundaries, which may be crisp, gradual or diffuse in the field. Likewise, materials and genesis may be displayed with symbol and/or colours in many combinations. Our classical map of Vorarlberg and Liechtenstein is an essentially field-based, area-covering inventory on paper at the detailed scale of 1:10000. The legend is a “box-of-bricks” of symbols and colours.

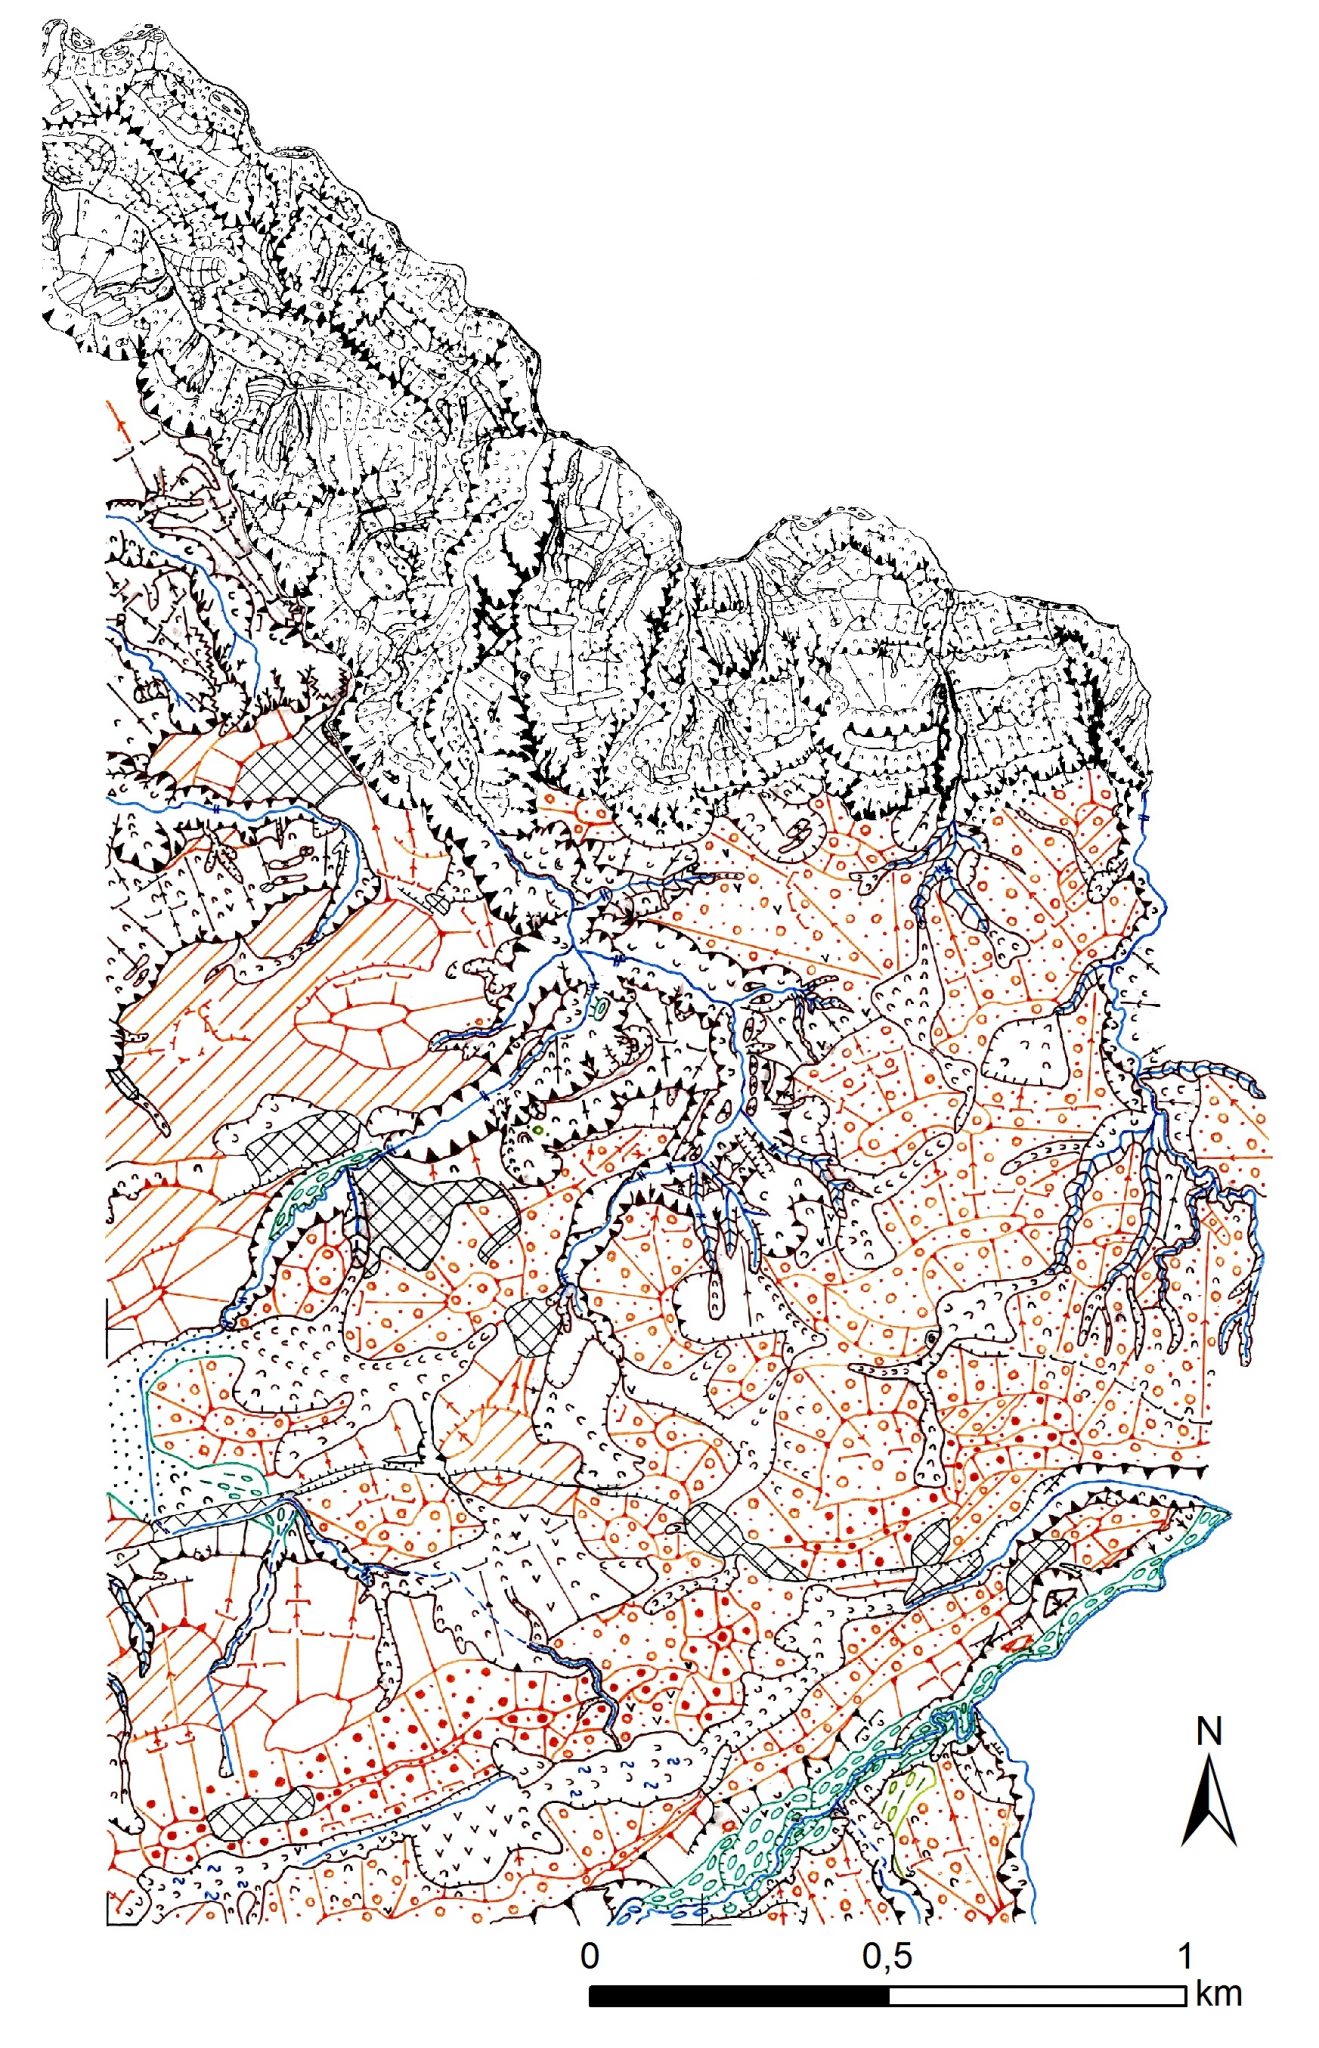
The above-right figure is the field–based and hand-drafted geomorphological map of the Weienried area (legend in above-left figure). The coloured part, which was mapped in the field at scale 1:10000, covers a gently undulating predominantly glacial terrain (orange colour). The black-and-white part in the north covers the flank of the valley of the river Rickenbach; the original mapping scale is 1:5000. With the exception of a few small (sub)recent river terraces (to be displayed in green), all features on the black-and-white map would be displayed in brown as fluvial-erosive and mass-movement landforms if applying the colours of the legend.
Computer-assisted geomorphological mapping
The computer-assisted (or computer-generated) geomorphological map is a digital collection of georeferenced data which provides scale-independent information on the Earth’s surface shape (morphometry/morphography), surface material distribution and formative processes, and is, in its most advanced form, accompanied by an accuracy assessment. Raw data and information are stored in a (geo-)database, which contains georeferenced raster, vector and tabular data. These data can be queried, analyzed and visualized in, for example, a Geographical Information System (GIS). The term ‘map’ has become somewhat inappropriate for these databases; for the sake of convenience, however, we still use it. A more appropriate term is digital geomorphological information layers. The data and layers are part of a geo-database which contains other types of information, e.g. a geoconservation assessment.
We have converted the legend of the classical geomorphological mapping to a morphogenetic classification scheme for use in computer-assisted mapping. Classical maps are converted to GIS-based maps in a relatively straightforward procedure of polygonizing and interpreting. Unmapped areas can be mapped in a similar manner, by polygonizing and interpreting in a GIS. For details refer to the recent publication on hierarchical geomorphological mapping by De Jong et al. (2021) in Journal of Maps (see Literature).

The above table shows the morphogenetic classification scheme (legend), with 33 classes, used in the computer-assisted geomorphological mapping of Vorarlberg. The figure on the right is the computer-assisted map of the Weienried area, which was made by converting the classical map to a digital polygon-based map.

The latest development: hierarchical geomorphological mapping
We have expanded the morphogenetic classification scheme of our computer-assisted mapping method to three levels, or tiers, arranged in a nested hierarchy Users can easily visualize maps in a geographical information system (GIS) at the finest level with a legend of 33 morphogenetic domains. Reclassification of the morphogenetic classes in an automated GIS-workflow generates the medium and high levels of hierarchy, and each tier is accompanied by suggested scale ranges for visualization. The method facilitates analysis, interpretation, visualization and application of geomorphological data at a large range of scales and corresponding information densities within one database. See the ESRI ArcGIS Storymap https://arcg.is/Xjvy4 for a dynamic and interactive explanation.

The hierarchical geomorphological mapping method illustrated by the map of Au West area. A high-resolution GeoPDF version of the figure is available as a supplement to the publication of De Jong et al. (2021). See Literature. An ESRI ArcGIS Storymap has been made to illustrate the method in a user-friendly interactive manner: Mapping the geomorphology of mountainous area
On a final note, fundamentally new, semi-automated and computer-based mapping techniques are nowadays also being developed. Main drivers behind this development are new quantitative techniques for analyzing landscapes and landscape change, the availability of high-resolution digital data of the Earth’s surface, such as laser altimetry data, and the ever-increasing processing and display capabilities of computers. The basic objects of geomorphological study – form, material and genesis of landforms – remain unchanged, but the practical approach is very different from the traditional way of making maps. For more details refer to Chapter 4 Progress on semi-automated geomorphological mapping of the book Geodiversity of Vorarlberg and Liechtenstein by Seijmonsbergen et al. (2014) and the book Modeling alpine geomorphology using laser altimetry data by Anders (2013).
Literature
If you need assistance in getting access to these publications, please contact us at info@rfase.org
Anders, N.S., 2013, Modeling alpine geomorphology using laser altimetry data. Ph.D. Thesis, University of Amsterdam, 143 pp.
Graaff, L.W.S. de, Jong, M.G.G. De, Rupke, J. & Verhofstad, J., 1987, A geomorphological mapping system at scale 1: 10,000 for mountainous areas. Zeitschrift fuer Geomorphologie N.F. 31, 229-242.
Gustavsson, M., Kolstrup, E. & Sijmonsbergen, A.C., 2006, A new symbol-based and GIS based detailed geomorphological mapping system; renewal of a scientific discipline for understanding landscape development. Geomorphology, 77, Issues 1-2, 90-111.
Jong, M.G.G. De, Sterk, H.P., Shinneman, S. & Seijmonsbergen, A.C., 2021: Hierarchical geomorphological mapping in mountainous areas. Journal of Maps. 17:2, 214-224. https://doi.org/10.1080/17445647.2021.1897047 See also GeoPDF in Supplemental to this publication. Storymap: https://arcg.is/Xjvy4
Seijmonsbergen, A.C., 2013, The Modern Geomorphological Map. In: Switzer, A.D. & D. Kennedy (Eds.), Treatise on Geomorphology, Vol. 14.4 Methods in Geomorphology. Elsevier, 35-52.
Seijmonsbergen, A.C., Jong, M.G.G. De, Graaff, L.W.S. de & Anders, N.S., 2014, Geodiversität von Vorarlberg und Liechtenstein. Geodiversity of Vorarlberg and Liechtenstein. Zürich, Bristol-Stiftung; Bern, Haupt. 304 S. 5 maps. ISBN 978-3-258-07888-5.